

AI-Powered · Peer-Reviewed · CSRD Ready
Know your food's carbon footprint. Act on it.
Reach Eat is the AI-powered CO₂ measurement platform built for restaurants, food producers and farmers. From ingredient to plate - measure, optimise and communicate your environmental impact in days, not months.
Trusted by26%
of global emissions come
from the food system
2026
CSRD compliance deadline for
EU food businesses
48 hrs
average time to your
first CO₂ report
The Challenge
Regulation is catching up with the food industry. Fast.
The EU Green Claims Directive, CSRD reporting, and growing consumer pressure mean that measuring your food's carbon footprint is no longer optional - it's a business requirement.
-
Traditional carbon assessments take months and cost tens of thousands. Most food businesses can't afford them.
-
CSRD, Scope 3 and the EU Green Claims Directive are reshaping what food businesses must prove and disclose.
-
73% of European consumers want to know the environmental impact of what they eat. A climate label is a competitive edge.
Who is it for
Built for every part of the food chain.
Whether you serve food, produce it, or grow it - REACH EAT gives you the tools to measure, report and reduce your environmental impact.

Restaurants
Carbon-label your menu. Attract climate conscious diners and stay ahead of regulation.

Food Producers
Scope 3 reporting for every SKU. Meet Corporate Sustainability Reporting Directive and retailer sustainability requirements.

Farmers
Understand your land's footprint. Access premium markets that reward low-carbon produce.
The Platform
Everything in one place.
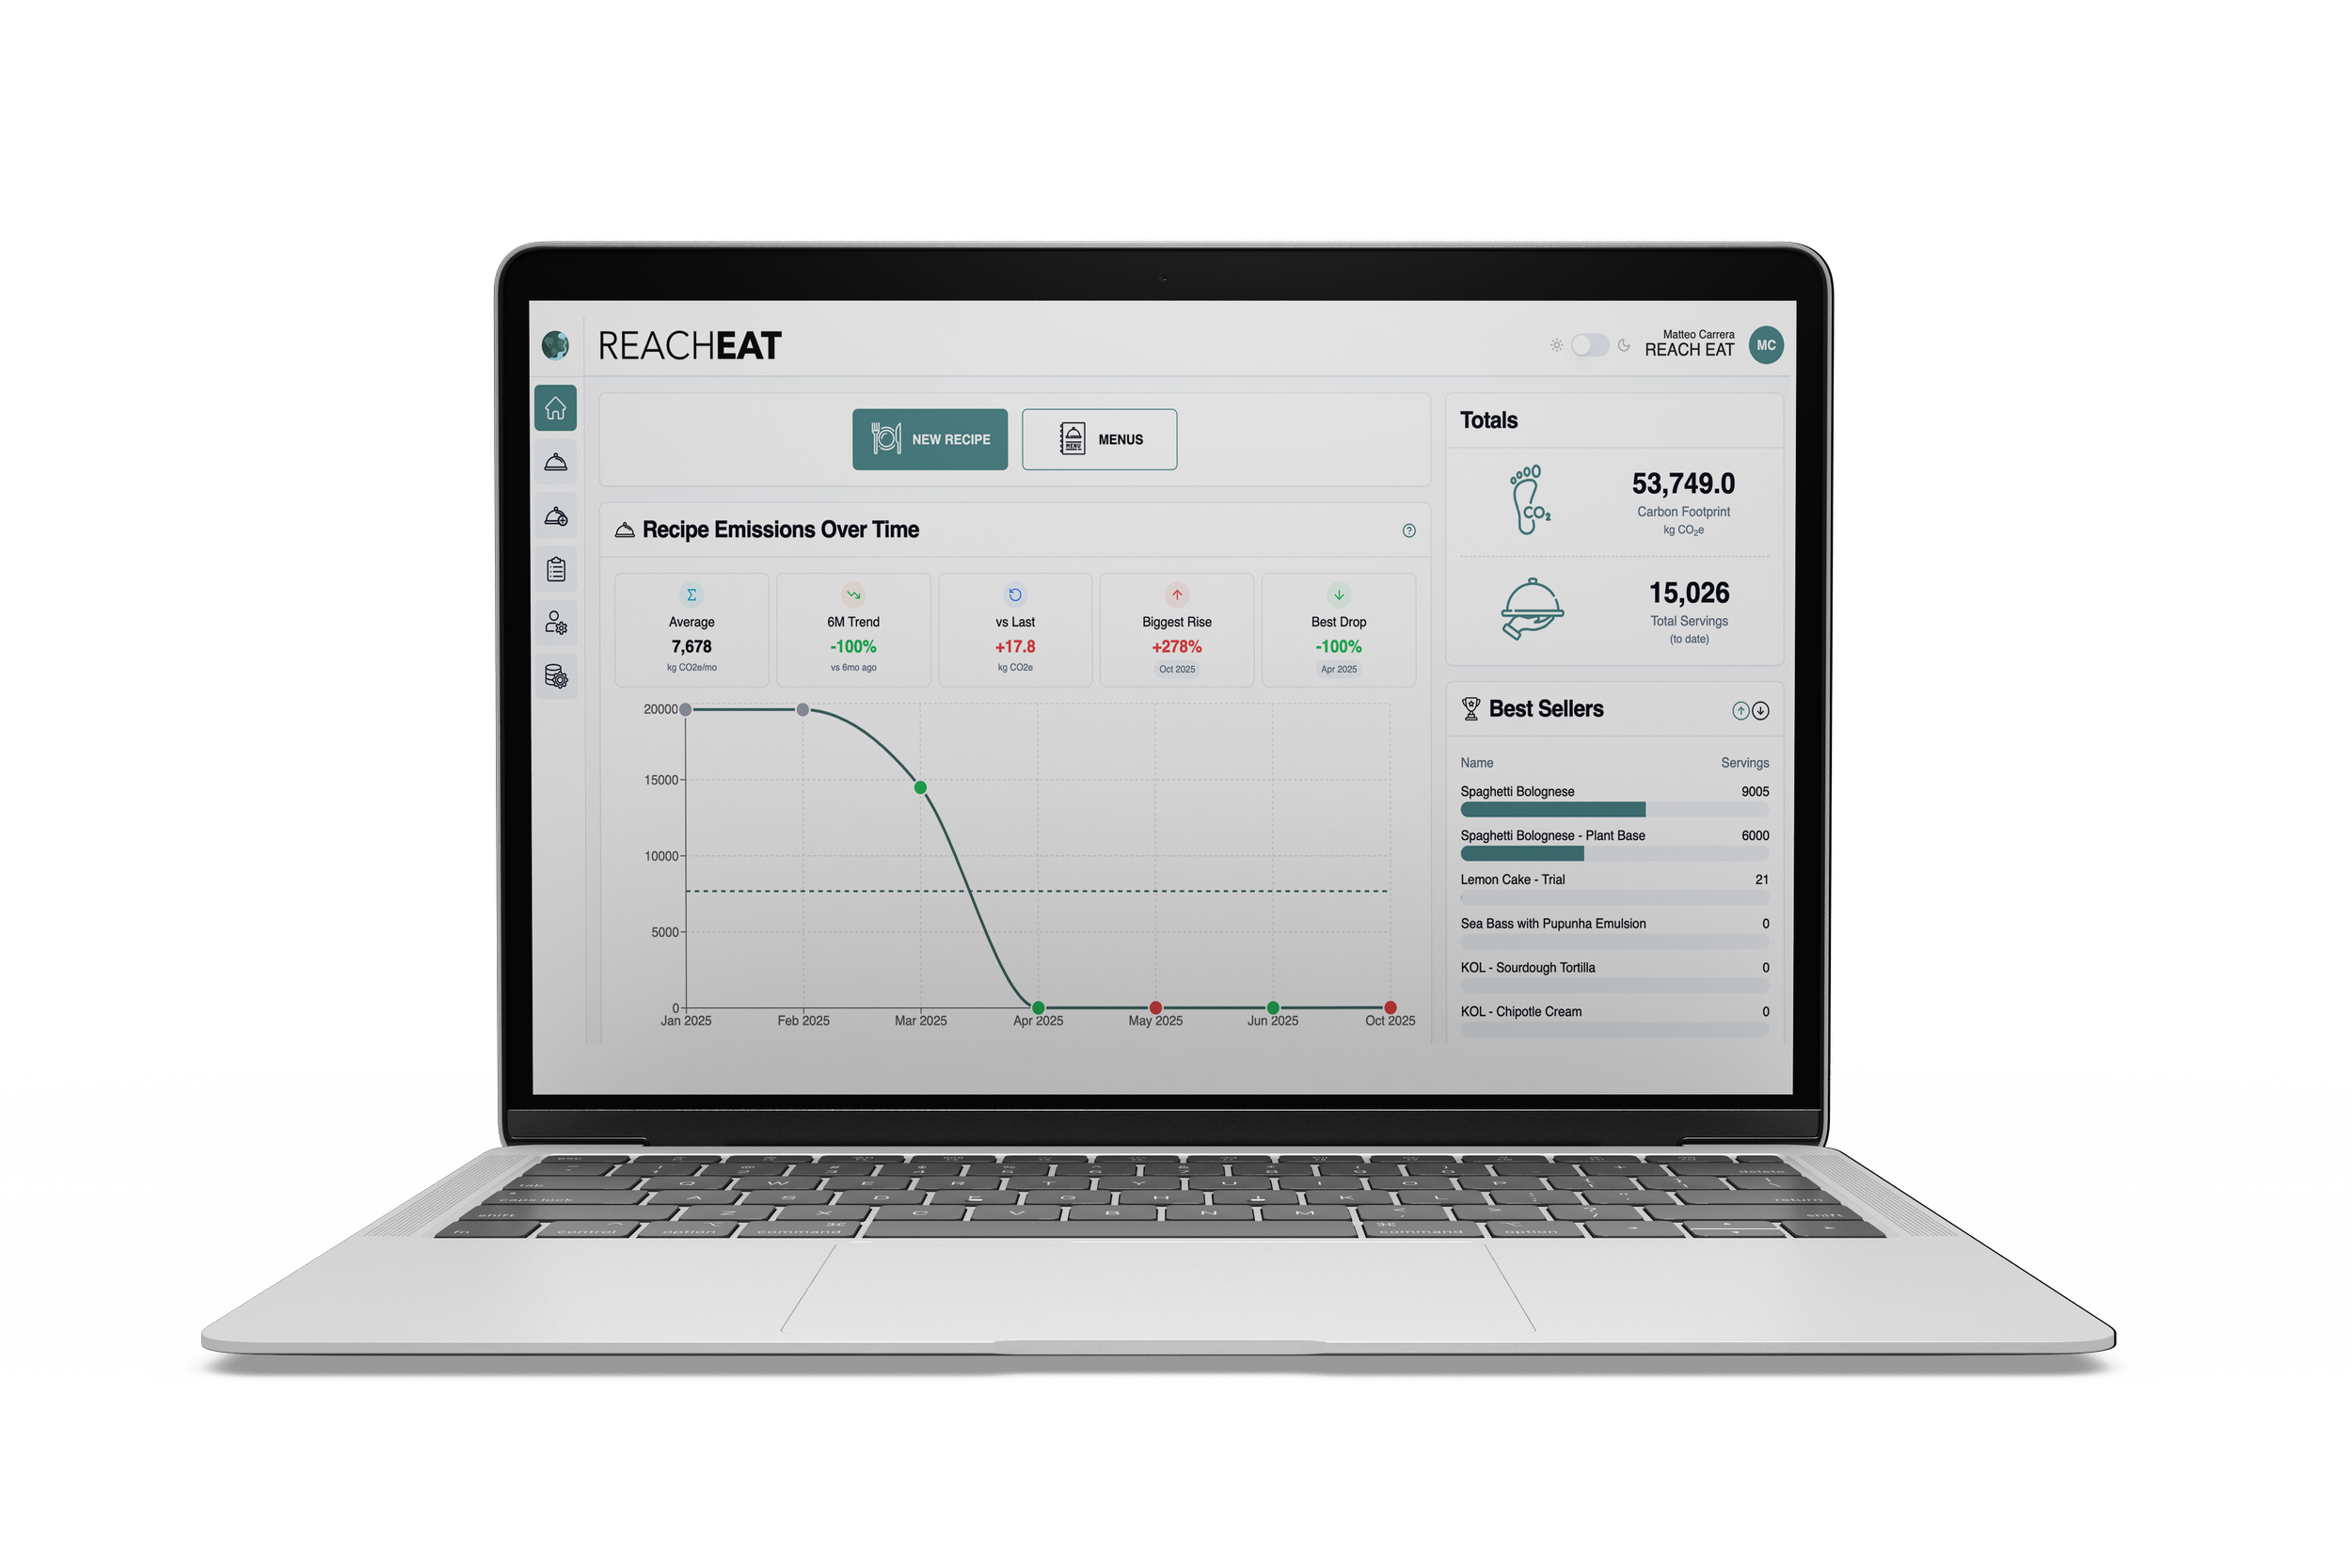
REACH EAT's SaaS platform combines AI-powered calculations, a 10,000+ food ingredient database, and a simple reporting interface - no carbon consultant needed.
-
Explore your food's environmental impact with our latest scientific research and data analysis throughout its life cycle.
-
REACH EAT can identify supply chain weak points, providing you with practical insights to minimise a food product's environmental footprint.
-
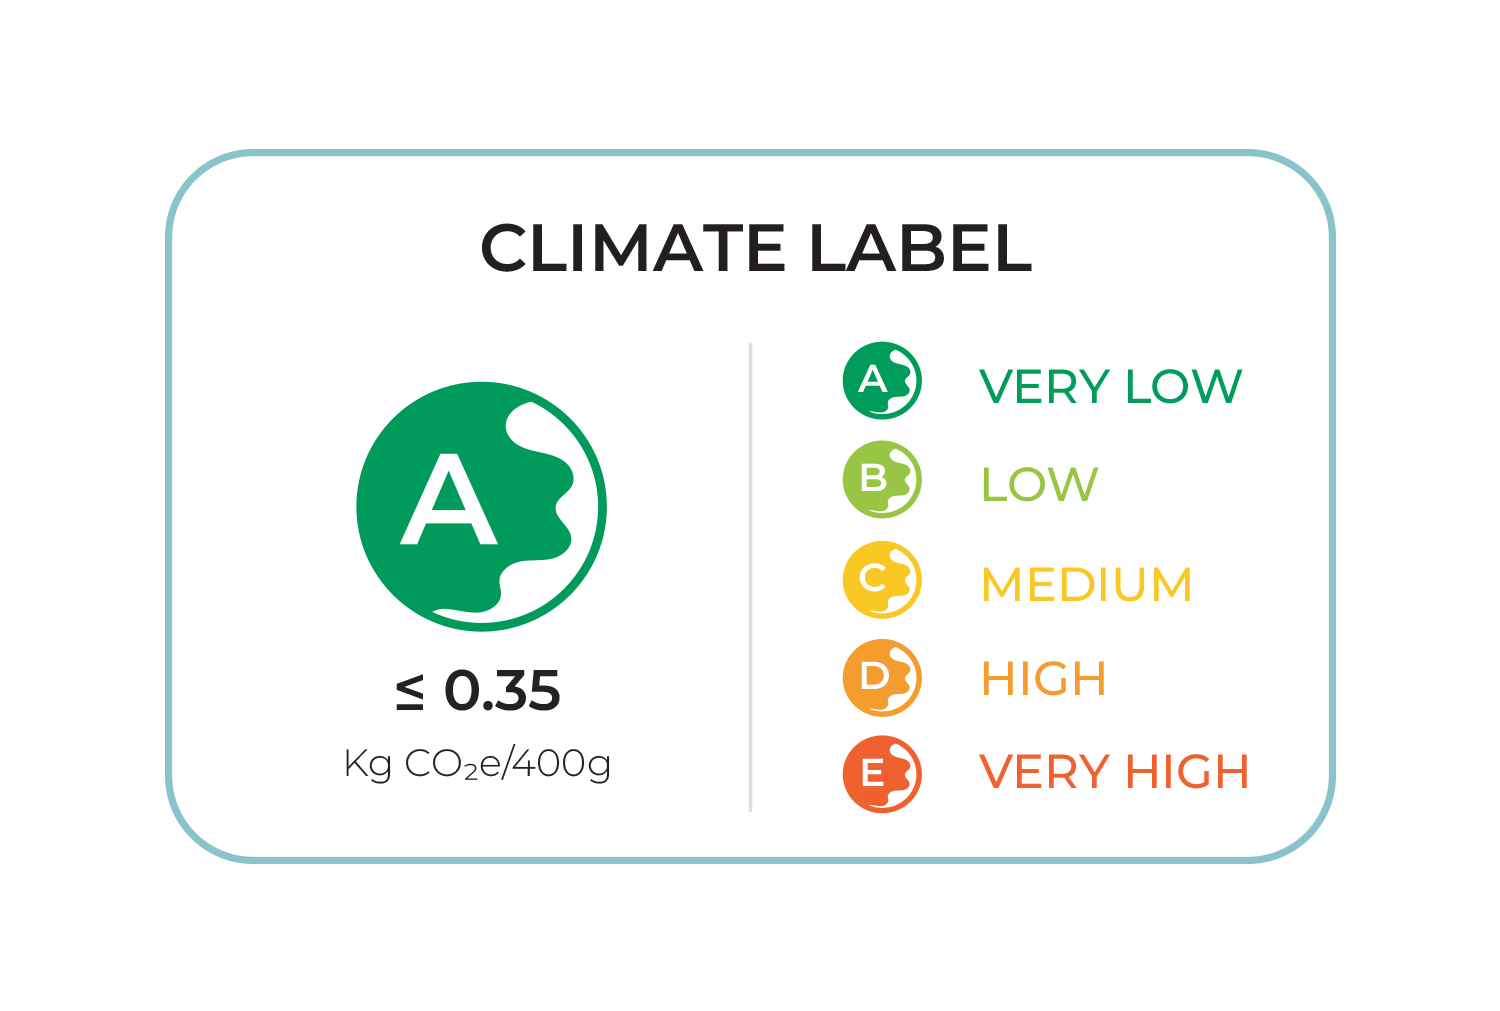
We translate complex calculations into simple language, so you can understand your impact through user-friendly climate labels.


Build on Science
Credible data. Verified methodology. Audit-ready outputs.
Every calculation is built on peer-reviewed LCA standards, aligned with the GHG Protocol, and validated by independent research.